Clear Title of Arizona is pleased to provide its clients with the Clear Connections Monthly Market Update. This report will provide you with the latest real estate trends.
Our business is built around the concept of educating and providing the personal service that Real Estate Agents and Lenders have come to depend upon. We want to provide accurate data to our clients, associates and friends. It is intended to keep you informed on critical market trends that affect our businesses.
SINGLE FAMILY HOME
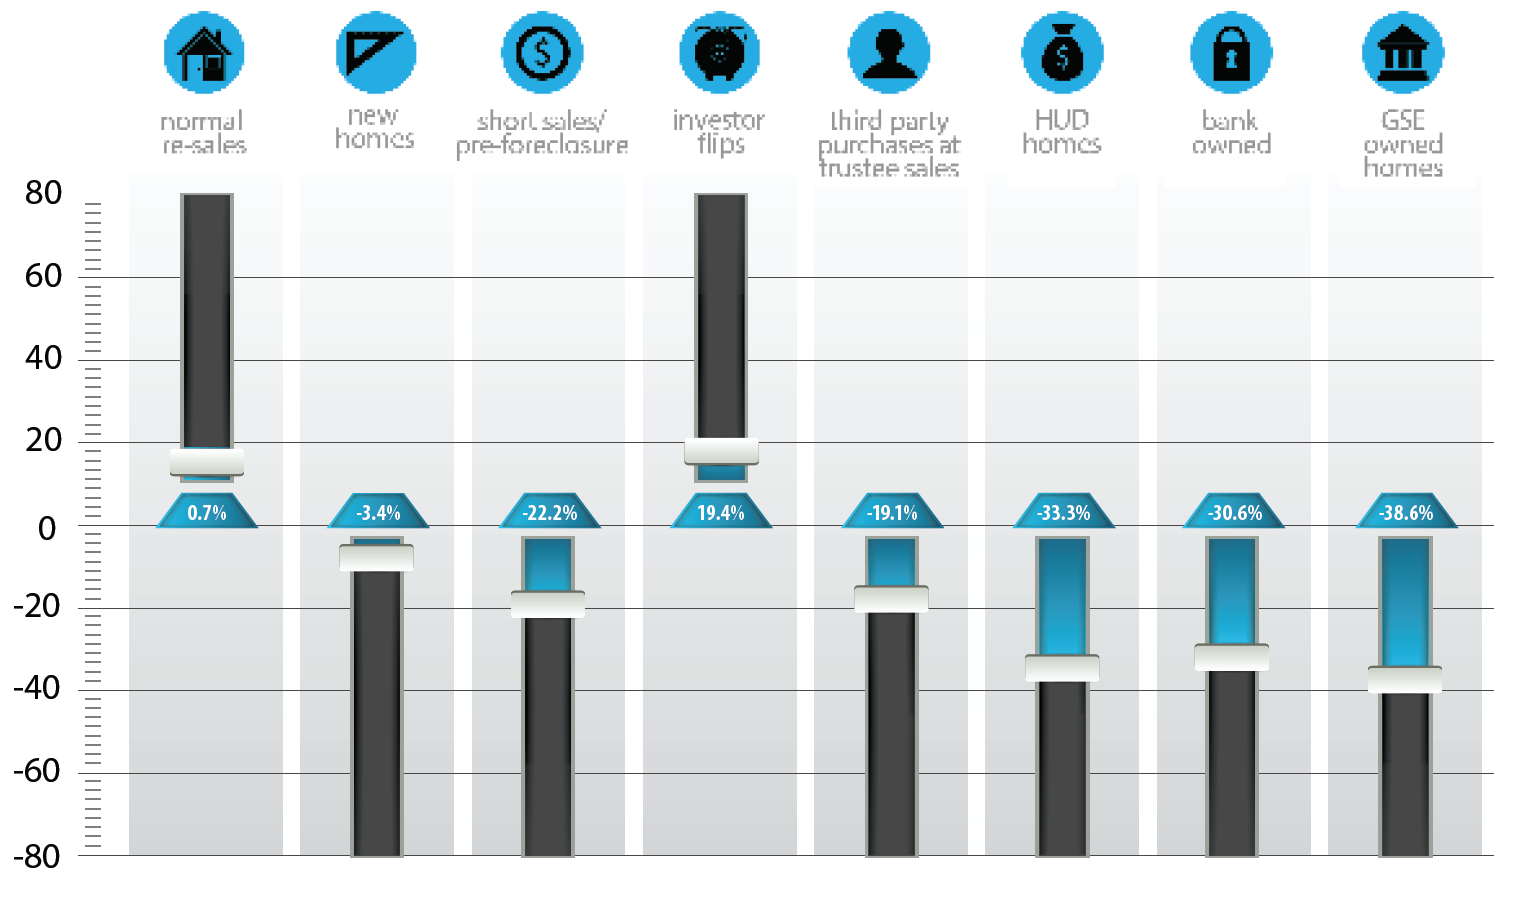
In December 2017, single family home sales increased year over year in three sectors, with investor flips growing fastest.
- Normal re-sales (up 1%)
- Investor flips (up 19%)
Because of lower distress levels, single family home sales decreased year over year in the remaining sectors:
- New homes (down 3%)
- GSE – Fannie Mae, Freddie Mac, etc. (down 39%)
- Bank owned homes (down 31%)
- Third party purchases at trustee sales (down 19%)
- Short sales / pre-foreclosures (down 22%)
- HUD homes (down 33%)
December 2017 had only 20 working days while December 2016 had 21. This partly explains the 0.1% fall in monthly sales year over year. Perhaps more surprising is the 3% fall in new home sales, the first such decline in several years.
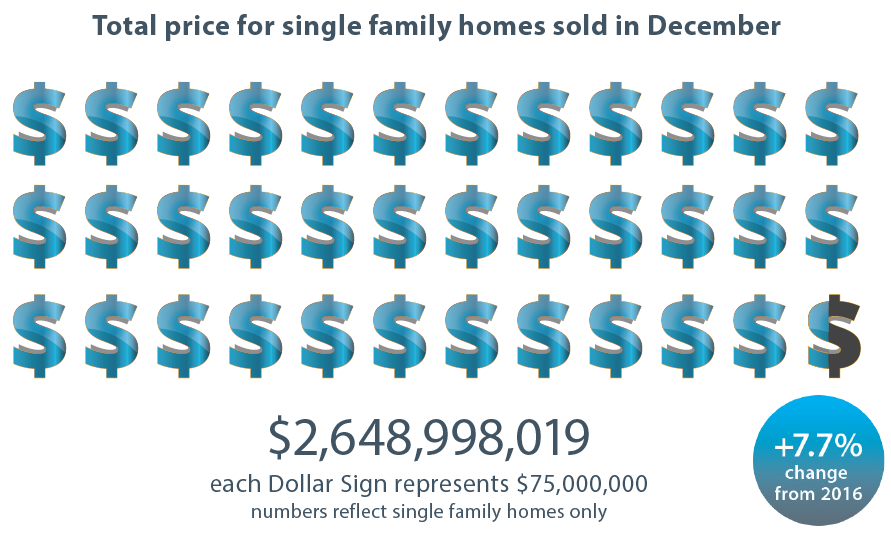
Due to rising prices, the change in total dollars spent on homes was more favorable than the change in the unit count.
- Total dollars spent on single family homes rose by 8% over November 2016.
- Total dollars spent on townhouses & condos rose by 21% over November 2016.
The advantage held by attached homes for several months, but which dissipated in November, re-asserted itself with a vengeance in December.
During December, average single family pricing moved higher, reading $320,547, up from $319,856 last month and up 7.6% from $297,378 in December 2016. Average new single family home prices during December were only 1.2% higher than last year at $371,658, but this was mainly because of a 3.3% drop in average new home size.
MEDIAN SALES PRICE
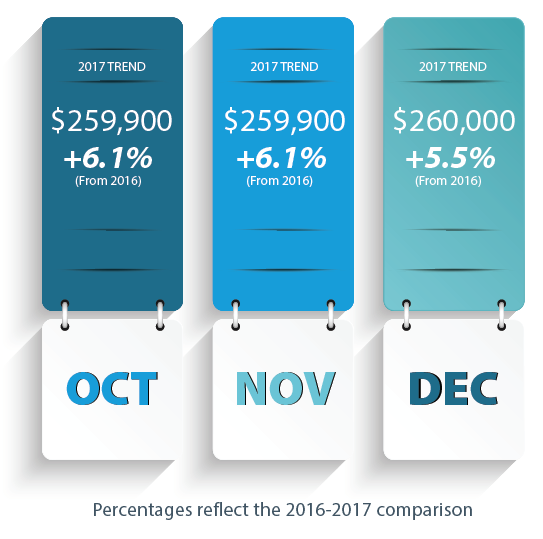
The median sales price rose 6.1% from $250,000 in Nov 2016 to $259,900 in Nov 2017.
NEW HOME SALES
Newly-built single-family homes saw 1,624 closings in December, down 3% from 1,682 in December 2016. The total dollar value of single-family new homes closed in December was down 2% from $618 million in 2016 to $604 million in 2017. However, townhouse / condo homes saw an increase of 26% from $45 million to $57 million, in contrast to last month’s decline.
The average sq. ft. of a new single family home in December was 2,386, down 3.3% from 2,468 in December 2016. The average sq. ft. of a non-distressed resale was 2,030, so new single-family homes are 18% larger on average than the existing homes that sold. For new-built townhouse / condos the average size was 33% larger than re-sales. The typical newly built condo or townhouse is far less affordable than the older stock of attached homes as a result.
The share (in dollars) for new homes in the single-family market has moved down sharply from 25.1% in December 2016 to 22.8% in December 2017.
DEMAND
Total single family, townhouse & condo sales were up 0.7% in December from a year earlier. Single-family sales fell 0.1% and townhouse/ condo sales rose 5.4% compared to December 2016.
Single-family homes priced over $500,000 took 26% market share in dollars, up from 23% last year. There was a 16% increase in unit sales over $500,000 while average pricing rose by 4%. Entry level single family homes under $200,000 lost market share from 16% to 12%, primarily due to low supply. The mid range between $200,000 and $500,000 has robust demand and reasonable supply and grew market share from 60% to 62%.
Townhouse/condos priced over $500,000 grew their market share from 12% to 21% while those under $200,000 dropped from 42% to a 34% share of the attached market. The mid-range took a 46% share in both December 2016 and 2017.
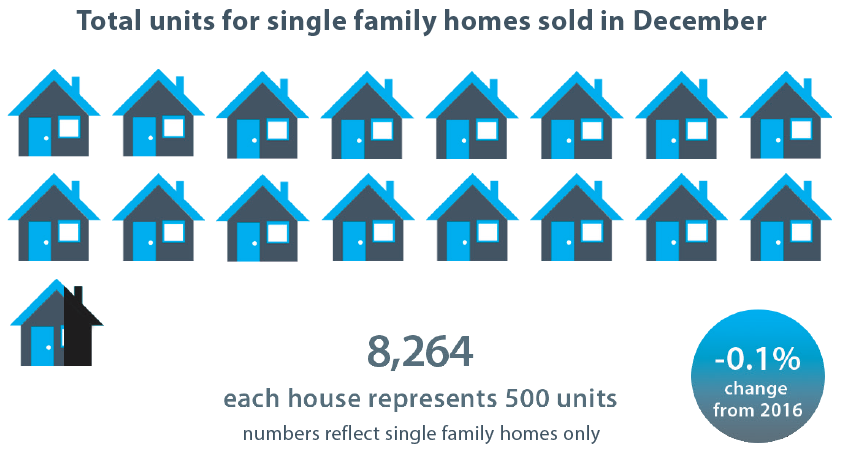
Numbers reflect single family homes only.
AVERAGE PRICE PER SQUARE FOOT
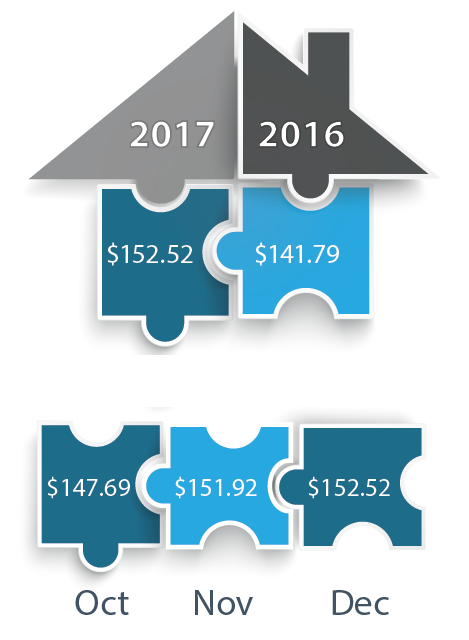
Average price per sq. ft. for single family homes
gained 7.6% from $141.79 in December 2016 to $152.52 in December 2017.
SUPPLY
The number of active single family listings without an existing contract was 12,640 for the Greater Phoenix area as of January 1, 2017. This is down 10.1% since December 1. The inventory of single family homes under $150,000 stands at 31 days, 21% lower than a year ago. So far we have seen almost the same number of new listings created in 2017 than in 2016. Supply is very constrained below $200,000 and inadequate to meet demand up to about $600,000. Supply is good over $600,000 but below $1,500,000, but continues to fall compared with last year and and is becoming scarce in a few more popular areas. Supply is very plentiful over $1,500,000 except for new homes which are usually snapped up quickly.
CHANGES IN TRANSACTION MIX
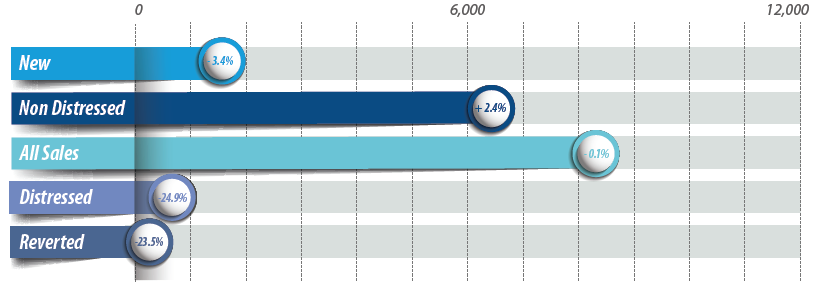
We saw an increase in non-distressed transactions (up 2% over this time last year), with investor flips growing by a very strong 19%. New home sales were up up compared with November, but down 3.4% compared with December 2016. Distressed transactions fell 25%. We saw a 19% decrease in third party purchases at trustee sales and new notices of foreclosure remain at very low levels. Reversions to lenders decreased by 23%. After an abnormal month in November, townhomes and condos took a larger share of the market once more.
2017 has remained similar to 2015 and 2016, but with the following notable differences:
- The year-to-date closed transaction rate is up 14% over last year
- New homes have increased their market share over existing homes
- Attached homes are gaining market share over single-family homes
- Homes under $200,000 are getting ever scarcer
- 2017 numbers favor the Southeast Valley and Pinal County
The increase in transactions is mainly due to buyers qualifying more easily for loans. This is not because lending standards have fallen, although underwriting rules have eased a little. Instead it is because buyers have higher credit scores and are finding down payments more easily. It is now several years since the end of the foreclosure wave and those former home owners affected are coming out of the penalty box and returning to the market with much better credit ratings than they had a couple years ago. We are also seeing loans close more swiftly than last year, which means listings spend less time in pending or UCB status and close more quickly after getting an acceptable offer. In 2016 it was the West Valley that had the most favorable conditions for sellers. In 2017 this has shifted in favor of Pinal County and the Southeast Valley. Here supply is well below last year and is causing major problems for buyers on a constrained budget. The high end of the market has picked up volume compared to last year, but the change in pricing is modest. Most of the appreciation is being driven by the market under $300,000. There are several fashionable areas where the luxury market remains strong, for example Arcadia and Old Town Scottsdale. In addition luxury condominiums are in short supply and high demand. In common with the rest of the USA, we are seeing ongoing challenges for large luxury single family home sellers in the more remote areas, especially those with homes over $2 million. This is caused by demographic trends as baby boomers retire and/or downsize and millennials enter the housing market. The mid range from $200,000 to $500,000 is currently very healthy and the lower end of the luxury market, from $500,000 to $1 million, is also looking significantly stronger than last year. The low end of the market looks as though it will never get relief for its chronic supply problem, and it may not be too long before homes under $200,000 are as rare as they were in 2006.
Data provided by: Michael Orr