Market Update October 2015
Clear Title of Arizona is pleased to provide its clients with the Clear Connections Monthly Market Update. This report will provide you with the latest real estate trends.
Our business is built around the concept of educating and providing the personal service that Real Estate Agents and Lenders have come to depend upon. It is with this philosophy that we offer data from the ASU W.P. Carey School of Business to our clients, associates and friends. It is intended to keep you informed on critical market trends that affect our businesses.
Please visit http://research.wpcarey.asu.edu/real-estate/residential-overview/ for a complete breakdown of the current real estate housing market.
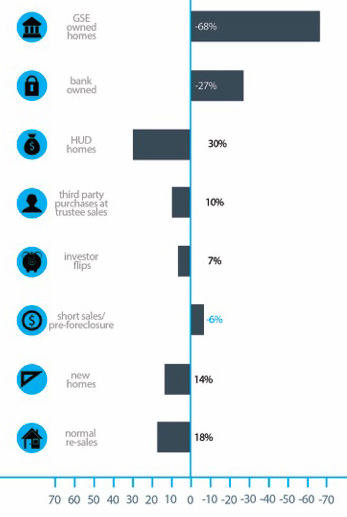 Single family homes sales increased year over year in three sectors:
- Normal re-sales (up 18%)
- New homes (up 14%)
- Investor flips (up 7%)
- Third party purchases at trustee sale (up 10%)
- HUD sales (up 30% – but from a very small base)
Single family home sales decreased year over year across three sectors:
- Short sales and pre-foreclosures (down 6%)
- Bank owned homes (down 27%)
- GSE (Fannie Mae, Freddie Mac, etc.) owned homes (down 68%)
The change in total dollars spent on homes was slightly more favorable than the change in the unit count.
- Total dollars spent on single family homes rose by 16% above August 2014.
- Total dollars spent on townhouses & condos rose by 11% above August 2014.
Overall pricing for single family homes has been stable for the last 18 months, but moved higher during the spring of 2015 and then settled back during the summer. This is a common seasonal pattern.
Median Sales Price
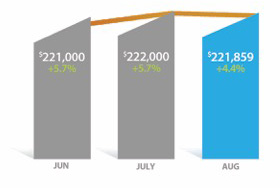
The median sales price was up 4.4% from $212,600 in August 2014 to $221,859 in August 2015.
New Homes Sales
New built single family homes saw 986 closings in August, 7% more than July and 14% above August 2014. The total dollar value of single family new homes closed in July was up 12% from $289 million in 2014 to $324 million in 2015.
The average sq. ft. of a new single family home in April was 2,488 while the average sq. ft. of a normal re-sale was 2,046. The fact that the average new home was 22% larger than the normal re-sale confirms the extent to which homebuilders have abandoned the entry-level market in favor of the move-up market, even though this percentage has dropped slightly over the past 2 months. It also shows us why the median sales price of new homes is 33% higher than for normal re-sales, but the average price per square foot is only 3% higher.
The market share for new single family homes went up from July to 12.7% in August similar to the 12.5% we saw in August 2014.
Demand
Total single family, townhouse & condo sales were 12% higher than August 2014, with single family homes up 13% and townhouse & condo sales up 9%. Townhome and condo market share was 13.3%, down from 13.7% last year.Homes priced over $500,000 took 21% dollar market share, down from 22% last year. Entry level homes under $200,000 lost market share from 25% to 22%, while the mid range between $200,000 and $500,000 rose from 54% to 56% and had the most robust sales growth relative to last year.
Total price for single family homes sold in August
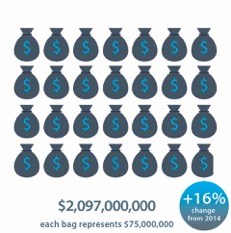
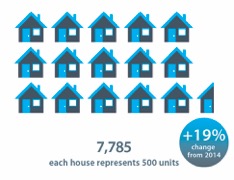
numbers reflect single family homes only
Total units for single family homes sold in August
Average Price Per Square Foot
Average price per square foot gained 4.0% from $125.04 to $129.98
Supply
The number of active single family listings without an existing contract was 14,235 for the Greater Phoenix area as of September 1. This is down 1.8%, since August 1. The inventory of single family homes under $150,000 stands at a very low 30 days, down from 57 days a year ago. Overall we have seen 0.4% fewer new listings created in 2015 than at the same stage in 2014, but about 0.4% more than in 2013 and 2.4% more than in 2012. We expect the active listing counts to increase over the next 3 months, following our usual seasonal pattern, but supply remains on a downward trend after accounting for seasonality.
Changes In transaction Mix
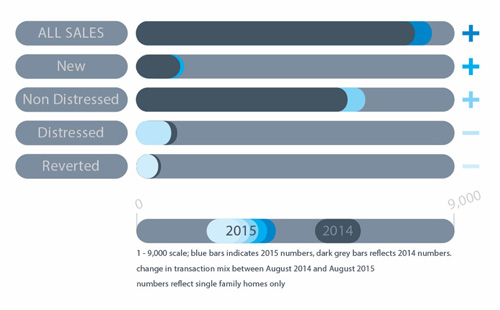
We saw growth in non-distressed transactions (17%) and new home sales (14%) but distressed transactions fell 19%. Reversions to lenders declined by 44%.
Outlook
Sales were still up 12% compared with August last year but dropped 11% from the elevated levels in July. Allowing for our seasonal patterns, demand remains healthy, but is no longer growing. We expect the price gains that took place between January and June to be followed by more consolidation during September and it is likely to be October before prices are able to gain upward momentum again. We expect this upward momentum to be primarily driven by entry level homes and the lower ranges of the move-up market up to $300,000. Much of the luxury market will probably tread water and some areas may even decline slightly until confidence returns to the stock market. The weakest luxury areas are likely to be those that depend most on out-of-state and second home buyers.
Please visit http://research.wpcarey.asu.edu/real-estate/residential-overview/ for a complete breakdown of the current real estate housing market.