Market Update July 2015
Clear Title of Arizona is pleased to provide its clients with the Clear Connections Monthly Market Update. This report will provide you with the latest real estate trends.
Our business is built around the concept of educating and providing the personal service that Real Estate Agents and Lenders have come to depend upon. It is with this philosophy that we offer data from the ASU W.P. Carey School of Business to our clients, associates and friends. It is intended to keep you informed on critical market trends that affect our businesses.
Please visit http://research.wpcarey.asu.edu/real-estate/residential-overview/ for a complete breakdown of the current real estate housing market.
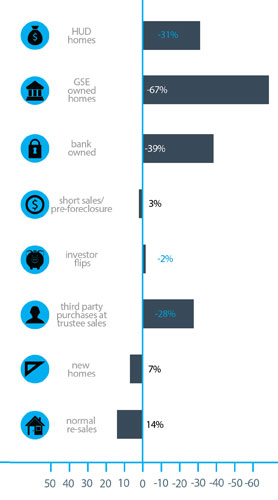 Single family homes sales increased year over year in three sectors:
- Normal re-sales (up 14%)
- New homes (up 7%)
- Short sales and pre-foreclosures (up 3%)
Single family home sales decreased year over year across five sectors:
- Investor flips (down 2%)
- Bank owned homes (down 39%)
- GSE (Fannie Mae, Freddie Mac, etc.) owned homes (down 67%)
- Third Party purchases at Trustee Sale (down 28%)
- HUD Sales (down 31%)
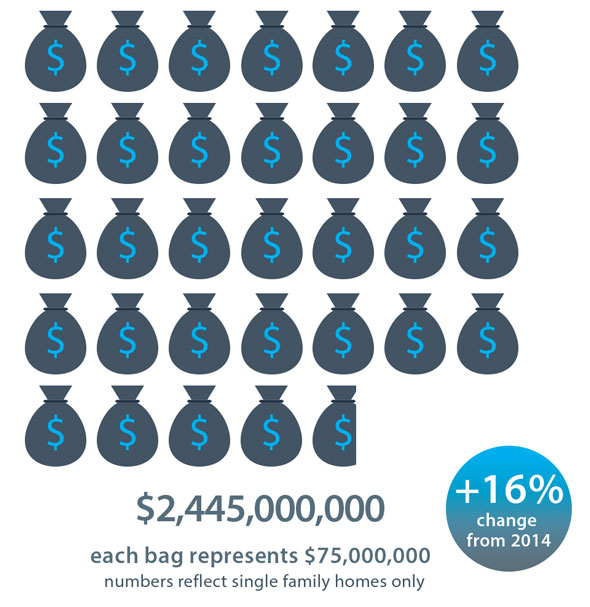
The change in total dollars spent on homes was more favorable than the change in the unit count.
- Total dollars spent on single family homes rose by 16% above May 2014.
- Total dollars spent on townhouses & condos rose by 19% above May 2014.
Overall pricing for single family homes has been very stable for much of the last 18 months, but is starting to gain upward momentum again.
Median Sales Price
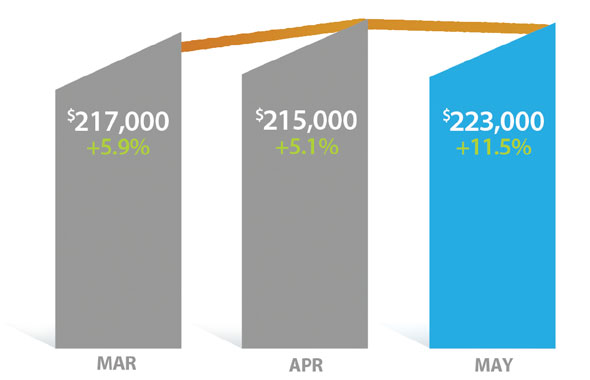
The median sales price was up 11.5% from $200,000 to $223,000.
New Homes Sales
Newly built single family homes saw 883 closings in May, 11% above April and 7% higher than May 2014. The total dollar value of single family new homes closed in May was up 14% from $269 million in 2014 to $308 million in 2015. The average sq. ft. of a new single family home in April was 2,552 while the average sq. ft. of a non-distressed re-sale was 2,038. The fact that the average new home was 25% larger than the typical resale confirms the extent to which homebuilders have abandoned the entry-level market in favor of the move-up market. It also shows us why the median sales price of new homes is so much higher than for re-sales, even though the price per square foot is very similar.
The market share for new single family homes was just over 10%, down slightly from May 2014.
Demand
Total single family, townhouse & condo sales were 8% higher than May 2014, with single family homes up 7% and townhomes condo sales up and 11%. Townhome and condo market share was 14.3%. Homes priced over $500,000 took 24% dollar market share, up from 23% last year. Homes under $200,000 lost market share from 27% to 22%, while the mid-range between $200,000 and $500,000 rose from 50% to 54%.
Total price for single family homes sold in May
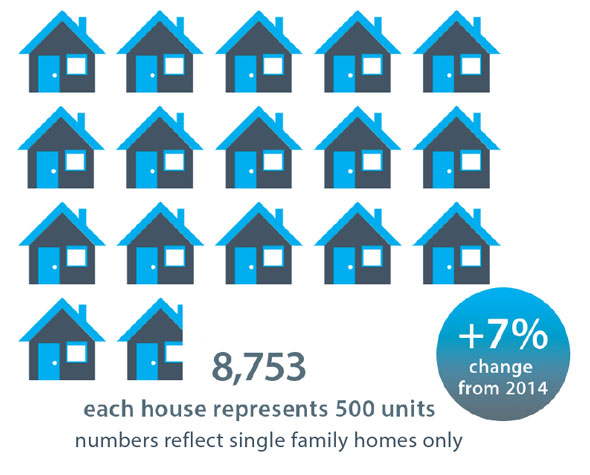
Total units for single family homes sold in May
Average Price Per Square Foot
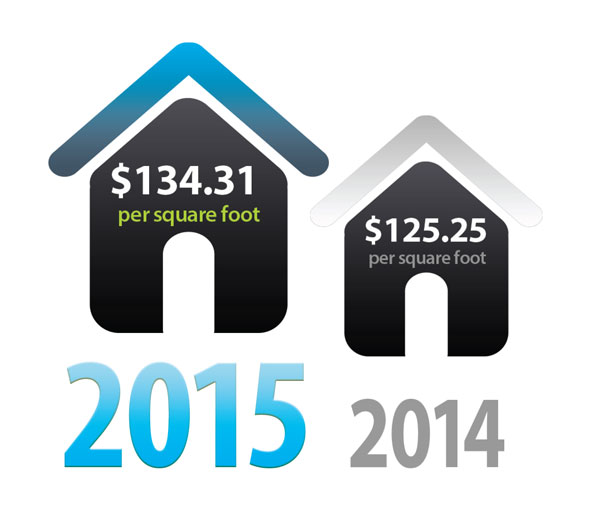
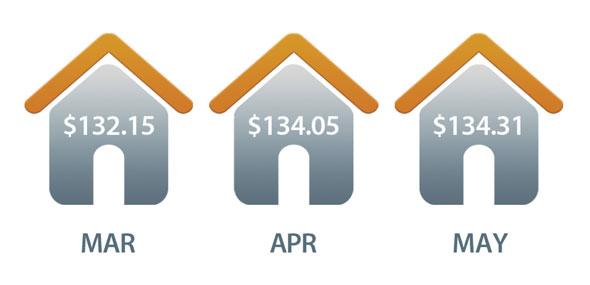 Average price per square foot gained 7.2% from $125.25 to $134.31.
Supply
The number of active single family listings without an existing contract was 15,133 for the Greater Phoenix area as of June 1. This is down 5.6% since May 1. The inventory of single family homes under $150,000 stands at a very low 30 days, down from 50 days a year ago. Overall we have seen 3% fewer new listings created in 2015 than at the same stage in 2014. Supply remains on a strong downward trend after accounting for seasonality.
Changes In transaction Mix
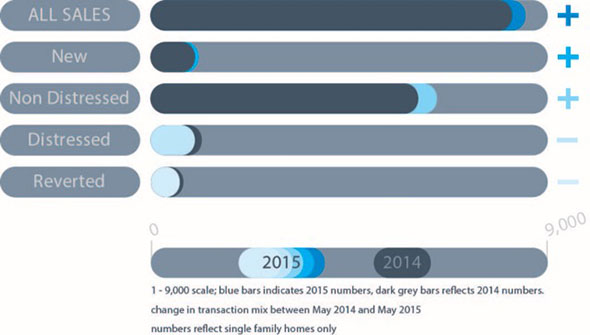
We saw growth in non-distressed transactions (13%) and new home sales 17%) at the expense of distressed transactions (down 30%).
Outlook
The housing market in May was essentially similar to April, with demand back to normal and supply shrinking. This is causing problems for buyers, especially at the affordable end of the market. We expect another strong month for sales in June, but our market usually cools off during the hottest months of July and August. The result is that the price gains that take place between January and June usually take a break for two or three months. However if the current supply shortage persists through the third quarter, we should expect more upward price pressure to resume from the end of September.
Please visit http://research.wpcarey.asu.edu/real-estate/residential-overview/ for a complete breakdown of the current real estate housing market.